Level 2
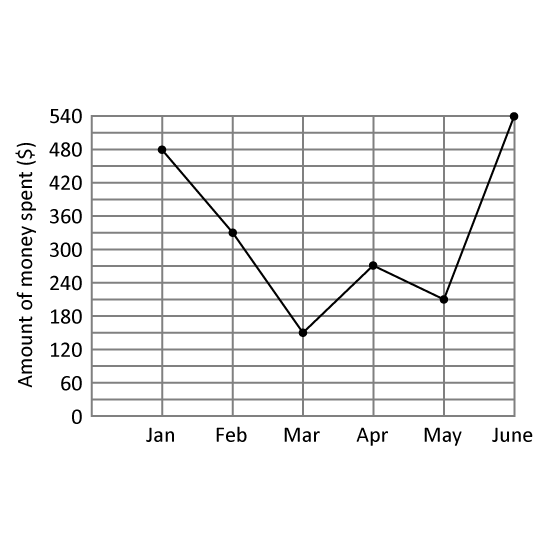
The line graph shows the amount of money Joseph spent from January to June.
Of the amount Joseph spent in February, $138 was spent on clothes and the remaining amount was spent on food. How much did he spend on food in February?
In which month did Joseph spend $120 more than the previous month? Give your answer in this format. (Eg Jan)
Level 2
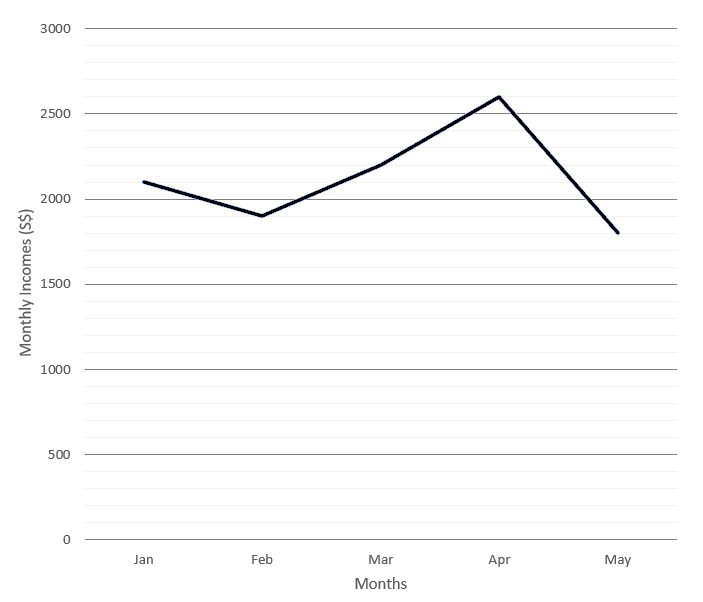
The line graph shows the amount of money Joseph spent from January to June.
Of the amount Joseph spent in February, $138 was spent on clothes and the remaining amount was spent on food. How much did he spend on food in February?
In which month did Joseph spend $120 more than the previous month? Give your answer in this format. (Eg Jan)
Level 3
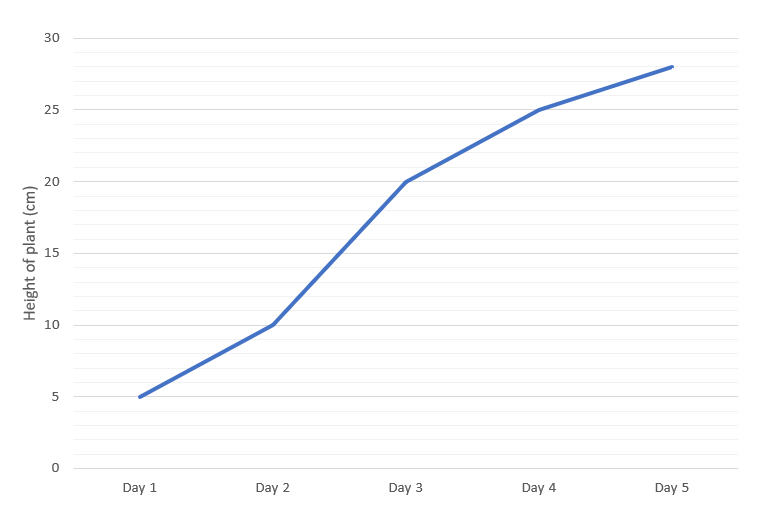
Marissa bought a plant that was 5 cm tall. Every morning, she measured the height of the plant and recorded its height for the day. The line graph shows her records.
What was the height of the plant when it was measured on Day 3?
Between which two days was the increase in the height of the plant the greatest? Give the answer in numbers. (Eg 1, 2)
In Day 6, the height of the plant dropped to 35 of Day 4. What is the height of the plant on Day 6?
Level 3
Marissa bought a plant that was 5 cm tall. Every morning, she measured the height of the plant and recorded its height for the day. The line graph shows her records.
What was the height of the plant when it was measured on Day 3?
Between which two days was the increase in the height of the plant the greatest? Give the answer in numbers. (Eg 1, 2)
In Day 6, the height of the plant dropped to 35 of Day 4. What is the height of the plant on Day 6?
Level 1 PSLE
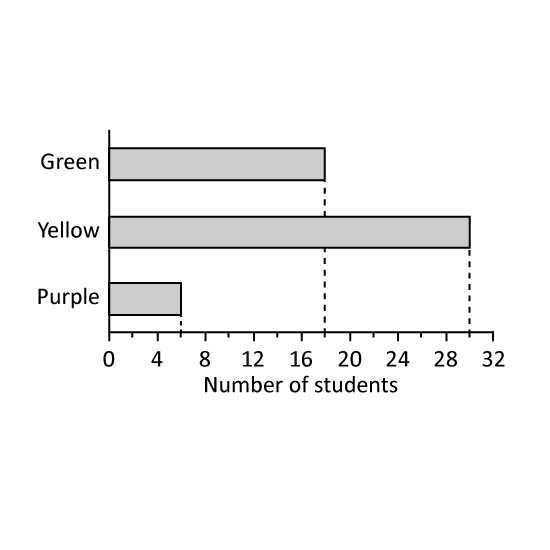
Mr Lim asked some students to choose their favorite colour for a T-shirt. The results are shown in the graph.
What is the ratio of the number of students who chose purple to the number who chose green to the number who chose yellow?
Mr Yip ordered a total of 360 T-shirts in the three colours according to the same ratio in part (a). How many more yellow than purple T-shirts were ordered?
Level 1 PSLE
Mr Lim asked some students to choose their favorite colour for a T-shirt. The results are shown in the graph.
What is the ratio of the number of students who chose purple to the number who chose green to the number who chose yellow?
Mr Yip ordered a total of 360 T-shirts in the three colours according to the same ratio in part (a). How many more yellow than purple T-shirts were ordered?