Level 3
The line graph shows the number of newspapers sold at a store over a week.
  1. On which day was the store closed? Give the answer in short form. (Eg Mon)
  2. How many more newspapers were sold on Monday than on Friday?
  3. On which two days were 4400 newspapers sold altogether? Give the answer in short form. (Eg Mon, Tue)
  4. If 9100 newspapers were sold from Monday to Sunday in the week, how many newspapers were sold on Sunday?
4 m
Level 3
The table shows the parking fees at a car park.
  1. Dylan parked his car at the carpark at 8.00 a.m. for 1 hour and 13 minutes. How much did he have to pay?
  2. Roshel parked her car at the car park from 6:20 p.m. on Monday to 8 a.m. on Tuesday. Find the amount of parking fee that she had to pay.
3 m
Level 3
The line graph shows the number of buns sold in a week.
  1. How many more buns were sold on Saturday than on Thursday?
  2. On which day was the number of buns sold thrice as many as the number of buns sold on Monday? Give your answer in this format. (Eg Mon)
4 m
Level 3
The line graph shows the number of boys and girls in each sports school.
  1. How many pupils were there in Sports School B?
  2. How many more girls than boys were there in Sports School C?
  3. At the end of the year, an equal number of boys and girls from Sports School D were transferred to Sports School A. The fraction of the number of boys to girls in Sports School A becomes 23. Find the total number of boys and girls that were transferred from Sports School D to Sports School A.
4 m
Level 3
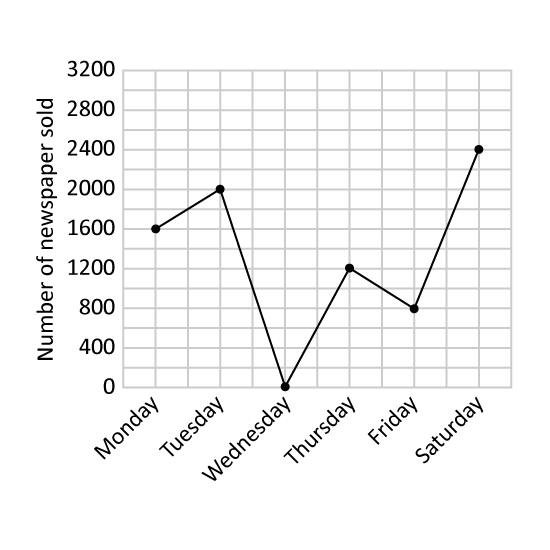
The line graph shows the total number of cars sold by a car dealer in the first six months of the year.
  1. In which two months were there a consecutive increase in the number of cars sold?  Give the answer in short form. (Eg Jan, Feb)
  2. What fraction of the cars was sold in the month of the lowest sale? 
  3. The car dealer was paid a fixed amount of money for every car he sold. He received $3200 more in April than in February. How much money did he receive from selling a car?
4 m
Level 2
The average mass of 2 grapefruits and 5 jackfruits is 2.4 kg. The average mass of each jackfruit is 2 kg. The difference in mass between the 2 grapefruits is 90 g. Find the mass of the heavier grapefruit. (Give your answer in kg and g.)
3 m
Level 3
The line graph shows the length of a spring when various masses are hung on it.
  1. What is the length of the spring when a 40 g mass is hung on it?
  2. What is the mass hung on the spring when its length is 26cm?
  3. What is the length of the spring when it is not stretched?
  4. How many centimetres is the spring stretched after a mass of 50 g is hung on it?
4 m
Level 2
The average weight of 5 students is 42 kg. When the weights of Fred and Cody are included, the average weight becomes 46 kg. Cody is 6 kg lighter than Fred. What is Fred's weight?
3 m
TRY FOR FREE
Level 3
Thiru played 5 games of bowling. His scores for the first 4 games were 120, 105, 176 and 169 points respectively.
  1. Find his average score for the first 4 games.
  2. After his fifth game, his average score increased by 3.1 points. Find his score for his fifth game.
3 m
Level 3
The average of 12 numbers is 34. If 3 of the numbers are excluded, the average of the remaining numbers is reduced to 29. Find the sum of these 3 numbers.
3 m