Level 3
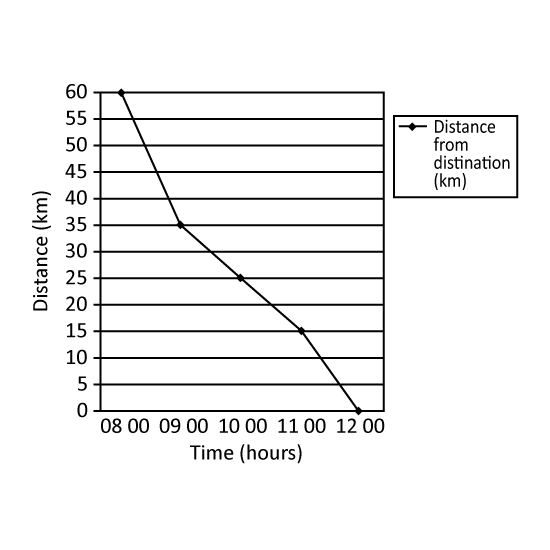
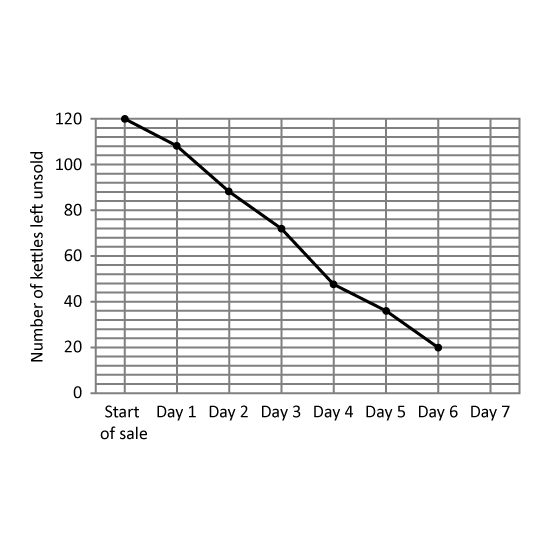
A departmental store had 120 kettles for sale during a 7-day period. The line graph shows the number of kettles left unsold at the end of each day. The number of kettles left unsold at the end of Day 7 was not shown.
On which day (from Day 1 to Day 7), was the greatest number of kettles sold? Give your answer in number. (Eg 1)
The average number of kettles sold for the last three days was 14. How many kettles were sold on Day 7?
Level 3
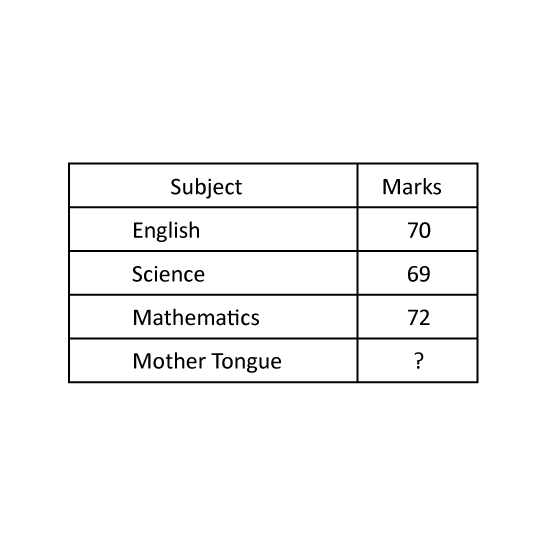
Some pupils took a Math exam. Their average score was 74.7 marks. One of the pupils' scores was wrongly recorded as 68 marks instead of 86 marks. As a result, the average score was calculated as 73.5 marks. How many pupils sat for the exam?
Level 3 PSLE
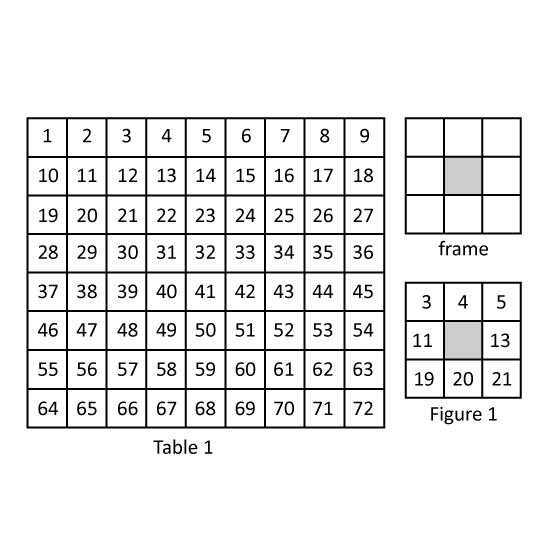
Table 1 consists of numbers from 1 to 72. Kenny and Lionel are given a plastic frame that covers exactly 9 squares of Table 1 with the centre square covered.
Kenny puts the frame on the 9 squares shown in Figure 1. What is the average of the 8 numbers that can be seen in the frame?
Lionel puts the frame on some other 9 squares. The sum of the 8 numbers that can be seen in the frame is 320. What is the smallest number that can be seen in the frame?
Level 3 PSLE
Table 1 consists of numbers from 1 to 72. Kenny and Lionel are given a plastic frame that covers exactly 9 squares of Table 1 with the centre square covered.
Kenny puts the frame on the 9 squares shown in Figure 1. What is the average of the 8 numbers that can be seen in the frame?
Lionel puts the frame on some other 9 squares. The sum of the 8 numbers that can be seen in the frame is 320. What is the smallest number that can be seen in the frame?
Level 3
Suzanne saved $468 in January. In February, her savings was 85% of the amount saved in January.
How much money did she save in February?
Suzanne was saving up money to go on a holiday which cost $2580. She has planned to save the remainder of the money for the holiday by the last day in June. What is the average amount of money she would need to save after January and February?
Level 3
Jade buys a coat, a vest, a sweater and a windbreaker. The average cost of these items is $36. The total cost of the sweater and the windbreaker is 35 of the total cost of the coat and the vest. If the coat costs $16.60 and the windbreaker costs $11.50, find the difference in cost between the vest and the sweater.
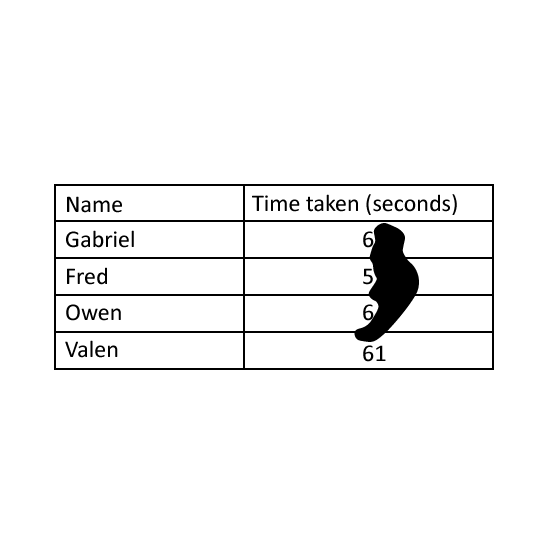
Level 3 The table shows the time taken by 4 participants in a race. All the times recorded are in whole numbers. Some of the time recorded were blocked by an ink drop. The average time taken by the 4 participants was 60 seconds. The difference between the time taken by Gabriel and Owen was 2 seconds. Find the shortest possible time taken by Fred.
Level 3 The table shows the time taken by 4 participants in a race. All the times recorded are in whole numbers. Some of the time recorded were blocked by an ink drop. The average time taken by the 4 participants was 60 seconds. The difference between the time taken by Gabriel and Owen was 2 seconds. Find the shortest possible time taken by Fred.
Level 3
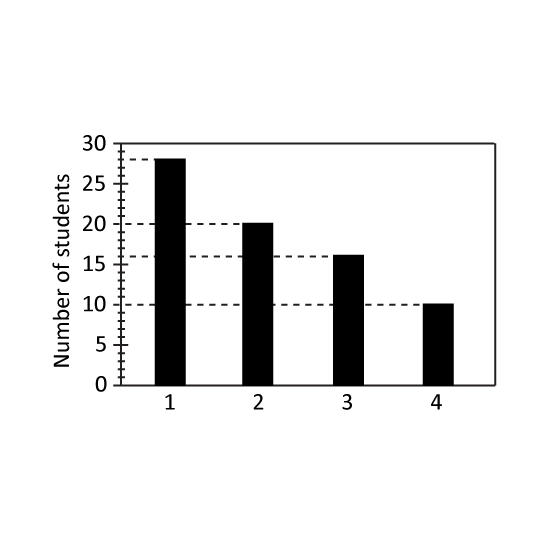
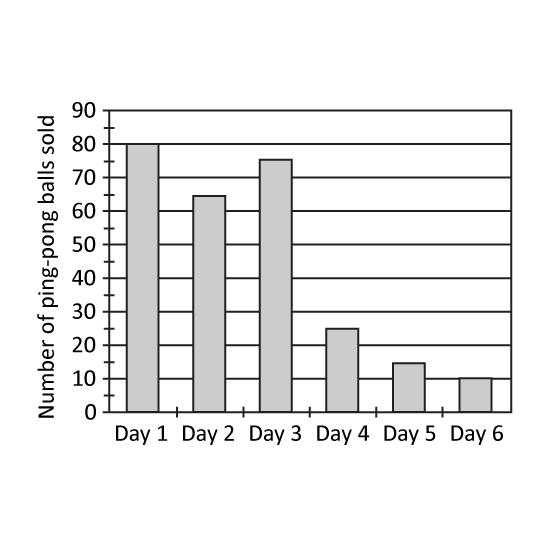
A sports shop had 300 ping-pong balls for sale. Each ping-pong ball is sold at $2. At the end of each day, the number of ping-pong balls was recorded in the bar graph shown.
What fraction of the total number of ping-pong balls was left at the end of Day 3? Express your answer in its simplest form.
If the shop decided to sell every 5 ping-pong balls at $9.30 from Day 4 onwards, how much less would it collect from the sale of the ping-pong balls?
Level 3
A sports shop had 300 ping-pong balls for sale. Each ping-pong ball is sold at $2. At the end of each day, the number of ping-pong balls was recorded in the bar graph shown.
What fraction of the total number of ping-pong balls was left at the end of Day 3? Express your answer in its simplest form.
If the shop decided to sell every 5 ping-pong balls at $9.30 from Day 4 onwards, how much less would it collect from the sale of the ping-pong balls?
Level 2
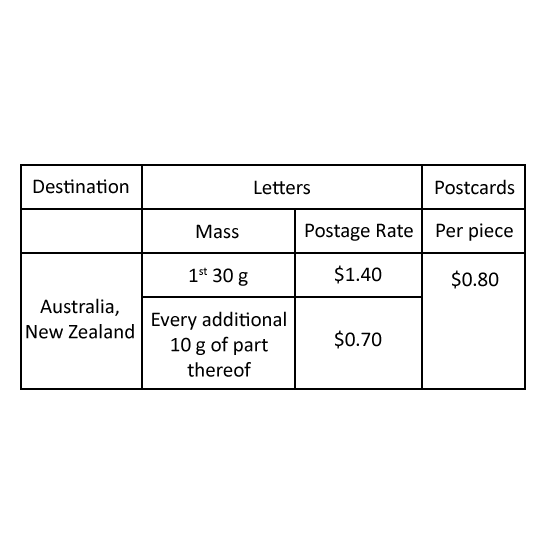
The table shows the airmail rates for sending letters and postcards to some countries.
How much did Elyse pay for the postage when she sent a letter which weighed 86 g and 8 postcards to New Zealand by airmail?
Level 2
The table shows the airmail rates for sending letters and postcards to some countries.
How much did Elyse pay for the postage when she sent a letter which weighed 86 g and 8 postcards to New Zealand by airmail?
Level 3
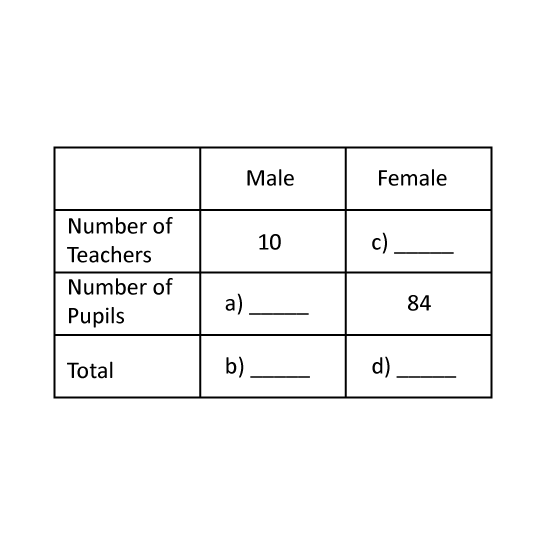
The table shows the number of teachers and pupils who went to Snow City. A total of 220 teachers and pupils went to Snow City. 198 of them are pupils. Complete the table.
Level 3
The table shows the number of teachers and pupils who went to Snow City. A total of 220 teachers and pupils went to Snow City. 198 of them are pupils. Complete the table.