Level 3
Linda and Melody's total mass is 51 kg. Melody and Nicole's total mass is 81 kg. Nicole is three times as heavy as Linda. What is the average mass of the three friends?
Level 2 PSLE
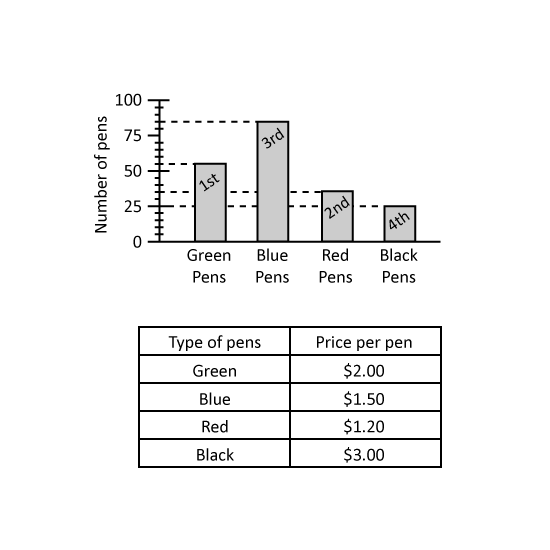
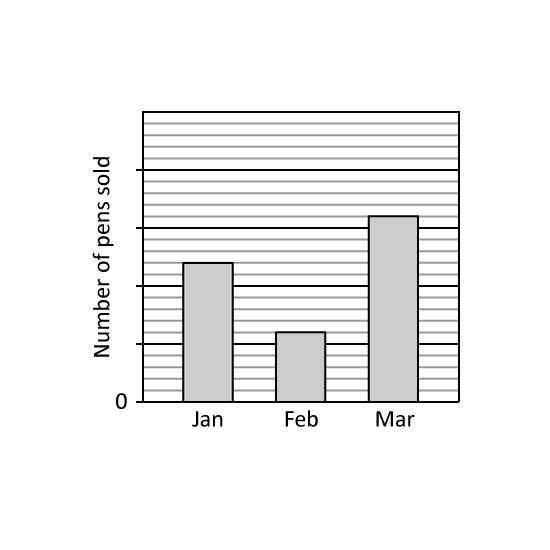
The bar graph shows the number of coloured pens sold by a shop. The table shows the prices of the pens.
What fraction of the pens sold were black pens? Give the answer in the simplest form.
From the sale of the pens, which coloured pens collected the least amount of money? What was the amount? Give the answers in the following way. (Eg Green, $1)
Level 2 PSLE
The bar graph shows the number of coloured pens sold by a shop. The table shows the prices of the pens.
What fraction of the pens sold were black pens? Give the answer in the simplest form.
From the sale of the pens, which coloured pens collected the least amount of money? What was the amount? Give the answers in the following way. (Eg Green, $1)
Level 3
Mrs Anis measured and recorded the mass of Amanda, Bee Ling, Charles and Dai Ling. The average mass of these 4 children was 49 kg. The next day, Mrs Anis realized that she had recorded Amanda's mass wrongly. Amanda's recorded mass was 8 kg more than her actual mass. What was the correct average mass of the 4 children?
Level 2 PSLE
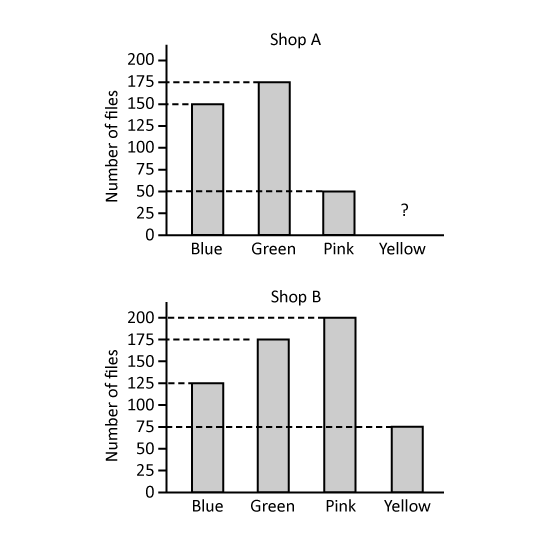
Shops A and B sell highlighters of four colours. The bar graphs show the number of highlighters sold by each shop in April.
The bar for the number yellow highlighters sold by Shop A has not been drawn.
Half of the highlighters sold by Shop A were yellow highlighters. How many yellow highlighters did Shop A sell?
Which colour(s) of highlighters did Shop A sell less than Shop B? (Give your answer(s) in letter(s) in alphabetical order. Eg Blue, Red = B, R
In May, Shop B sold 75 more blue highlighters than the number of blue highlighters sold in April. What was the percentage increase in the number of blue highlighters sold by Shop B from April to May?
Level 2 PSLE
Shops A and B sell highlighters of four colours. The bar graphs show the number of highlighters sold by each shop in April.
The bar for the number yellow highlighters sold by Shop A has not been drawn.
Half of the highlighters sold by Shop A were yellow highlighters. How many yellow highlighters did Shop A sell?
Which colour(s) of highlighters did Shop A sell less than Shop B? (Give your answer(s) in letter(s) in alphabetical order. Eg Blue, Red = B, R
In May, Shop B sold 75 more blue highlighters than the number of blue highlighters sold in April. What was the percentage increase in the number of blue highlighters sold by Shop B from April to May?
Level 3
The average mass of a group of girls is 45 kg. If one more girl who weighs 75 kg joins the group, the new average mass of the group will become 48 kg. Find the total number of girls in the group.
Level 3
The average number of pages Joan read in a certain number of days was 15. In the next four days, Joan read another 88 pages. As a result, the average number of pages she read increased to 17. How many days did Joan read in total?
Level 3
The average test score of a class was 60 marks. After two students who scored an average marks of 96 marks transferred out of the class, the average score of the remaining students became 58 marks. How many students were there in the class at first?
Level 3
The average amount of money collected by a group of students at a flag day event was $125. When another 15 students turned up to help, the total amount donated increased by $1275 and the average amount of money collected became $113. How many students were there in the group at first?
Level 3
The average test score of a group of pupils was 57 marks. After 4 pupils who scored an average of 69 marks joined the group, the average score of all the pupils became 61 marks. How many pupils were there in the group at first?