Level 2
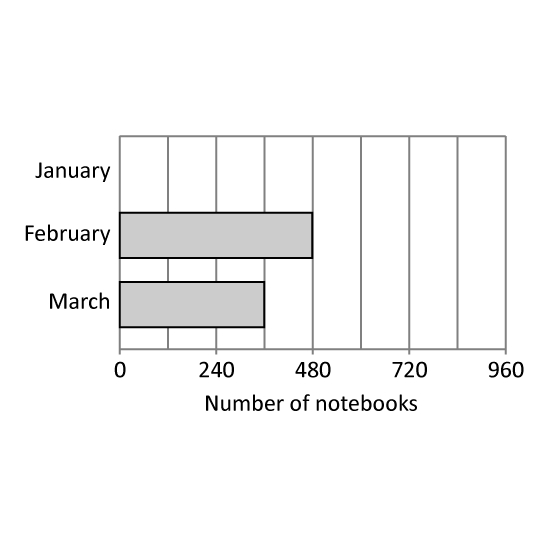
The bar graph shows the number of notebooks sold in 3 months. The bar that shows the number of notebooks in January is not drawn.
38 of the total number of notebooks sold in the 3 months were sold in January. How many notebooks were sold in January?
Level 2
The bar graph shows the number of notebooks sold in 3 months. The bar that shows the number of notebooks in January is not drawn.
38 of the total number of notebooks sold in the 3 months were sold in January. How many notebooks were sold in January?
Image in this question is not available.
Level 1 PSLE
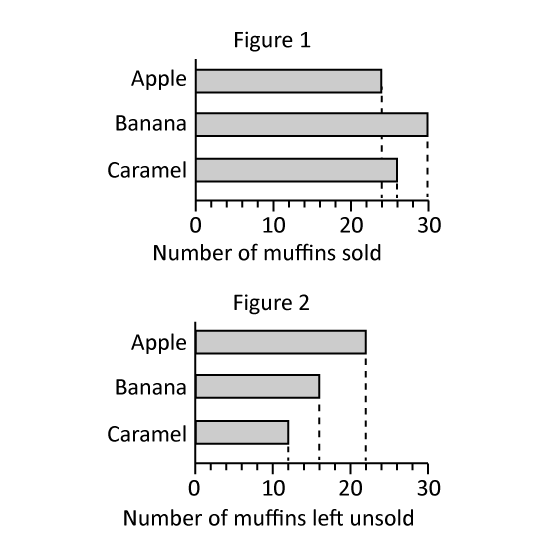
Jen baked some muffins to sell at a funfair. Figure 1 shows the number of muffins that was sold. Figure 2 shows the number of muffins left unsold at the end of the funfair.
- What was the number of caramel muffins Jen baked?
- Altogether, how many apples and banana muffins were left unsold after the funfair?
Level 1 PSLE
Jen baked some muffins to sell at a funfair. Figure 1 shows the number of muffins that was sold. Figure 2 shows the number of muffins left unsold at the end of the funfair.
- What was the number of caramel muffins Jen baked?
- Altogether, how many apples and banana muffins were left unsold after the funfair?
Image in this question is not available.
Level 2
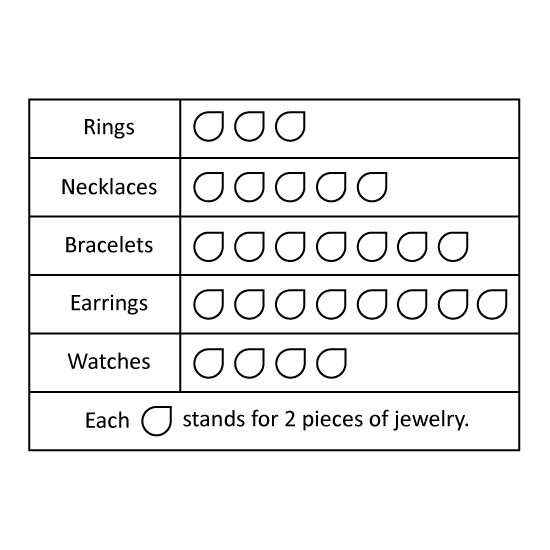
If the cleaning fee for each jewelry is $2, what is the total amount collected from all the pieces of jewellery?
Level 2
If the cleaning fee for each jewelry is $2, what is the total amount collected from all the pieces of jewellery?
Image in this question is not available.
Level 2
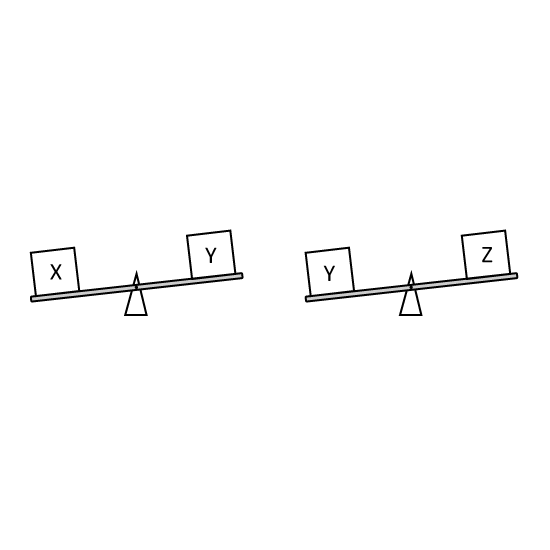
Robert was comparing the mass of 3 boxes as shown . If you will make a line graph for this, which box is at the highest point? Express your answer as the letter of the correct box.
Level 2
Robert was comparing the mass of 3 boxes as shown . If you will make a line graph for this, which box is at the highest point? Express your answer as the letter of the correct box.
Image in this question is not available.
Level 2
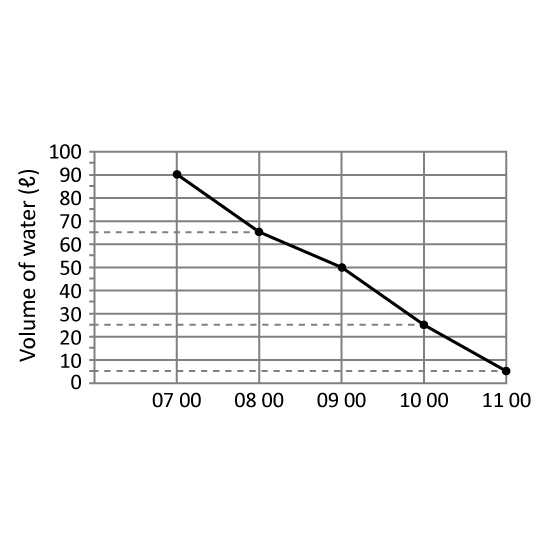
A tank was filled with 90 ℓ of water at 07 00. Water flowed out of the tank from 07 00 to 11 00. The line graph shows the amount of water in the tank from 07 00 to 11 00. Which one-hour period shows the least decrease in the amount of water in the tank? Give your answer in this format. (Eg 12 00 to 13 00)
Level 2
A tank was filled with 90 ℓ of water at 07 00. Water flowed out of the tank from 07 00 to 11 00. The line graph shows the amount of water in the tank from 07 00 to 11 00. Which one-hour period shows the least decrease in the amount of water in the tank? Give your answer in this format. (Eg 12 00 to 13 00)
Image in this question is not available.
Level 1 PSLE
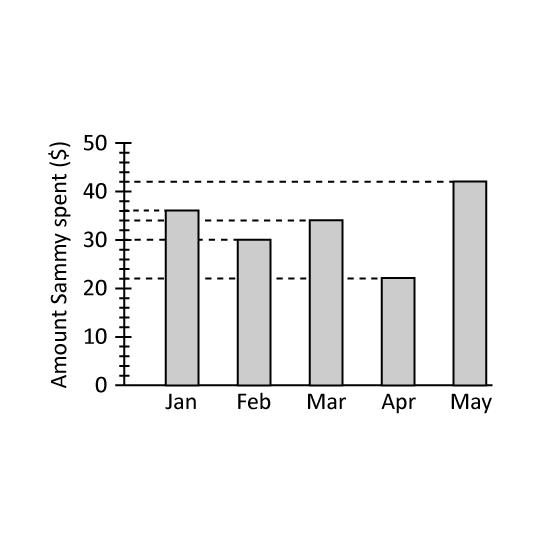
The bar graph shows the amount of pocket money Sammy spent each month from January to May.
- How much more money did Sammy spend in March than in April?
- Which months did Sammy spent more than $35? Give your answers in numbers in ascending order. (Eg Jan & Feb = 1, 2)
Level 1 PSLE
The bar graph shows the amount of pocket money Sammy spent each month from January to May.
- How much more money did Sammy spend in March than in April?
- Which months did Sammy spent more than $35? Give your answers in numbers in ascending order. (Eg Jan & Feb = 1, 2)
Image in this question is not available.
Level 2
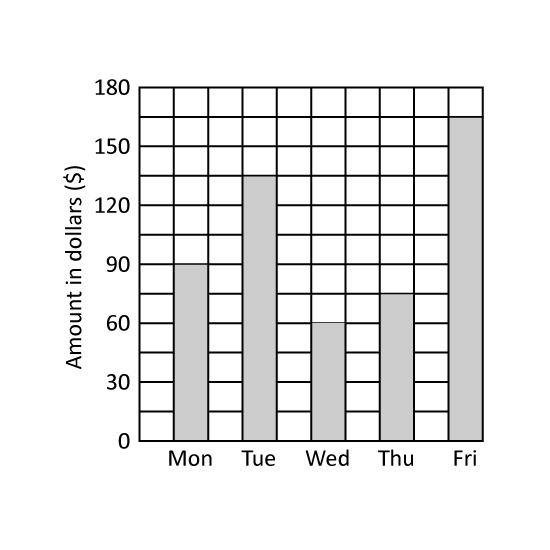
The graph shows the amount of money Amy earned from selling ice cream over five days. How much less did she earn on Tuesday than on Friday?
Level 2
The graph shows the amount of money Amy earned from selling ice cream over five days. How much less did she earn on Tuesday than on Friday?
Image in this question is not available.
Level 2
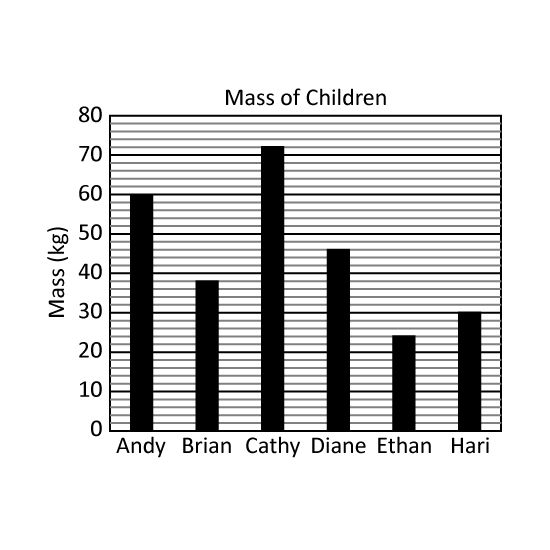
The graph shows the mass of 6 children in kilograms.
- Who is three times as heavy as Ethan? Give the first letter of the answer. (Eg Apple = A)
- What is the total mass of the 3 heaviest children?
Level 2
The graph shows the mass of 6 children in kilograms.
- Who is three times as heavy as Ethan? Give the first letter of the answer. (Eg Apple = A)
- What is the total mass of the 3 heaviest children?
Image in this question is not available.
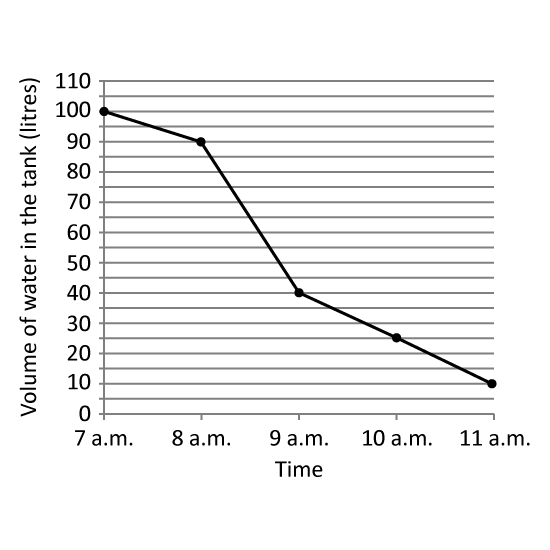
Level 2
A tank was completely filled with water at 7 a.m Water flowed out of the tank from 7 a.m. to 11 a.m. The line graph shows the volume of water in the tank at each 1-hour interval from 7 a.m. to 11 a.m. At what time was 14 of the tank filled with water?
Level 2
A tank was completely filled with water at 7 a.m Water flowed out of the tank from 7 a.m. to 11 a.m. The line graph shows the volume of water in the tank at each 1-hour interval from 7 a.m. to 11 a.m. At what time was 14 of the tank filled with water?
Image in this question is not available.
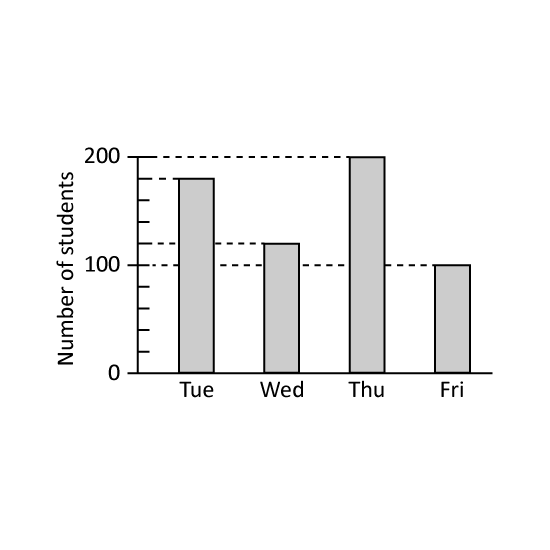
Level 1 PSLE
A school conducted checks on its Primary 6 students' eyesight from Tuesday to Friday. Each student had their eyes checked on one of the four days. The bar graph shows the number of students that were checked on each day. What percentage of the Primary 6 students had their eyes checked on Tuesday?
Image in this question is not available.