Level 1
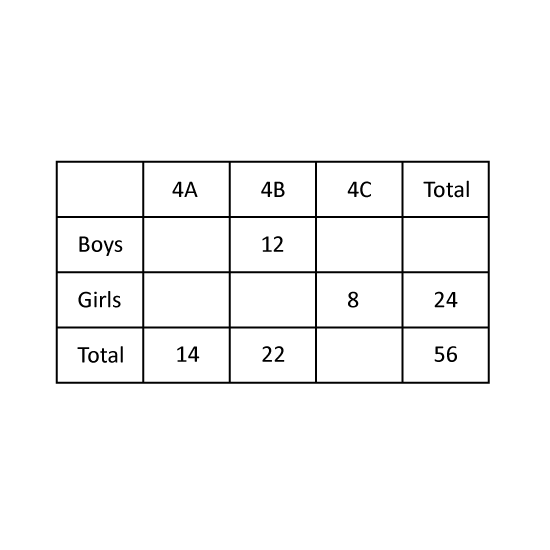
The table shows some information about the number of pupils who wear spectacles in classes 4A to 4C. How many girls in 4A wear spectacles?
Level 1
The table shows some information about the number of pupils who wear spectacles in classes 4A to 4C. How many girls in 4A wear spectacles?
Image in this question is not available.
Level 2
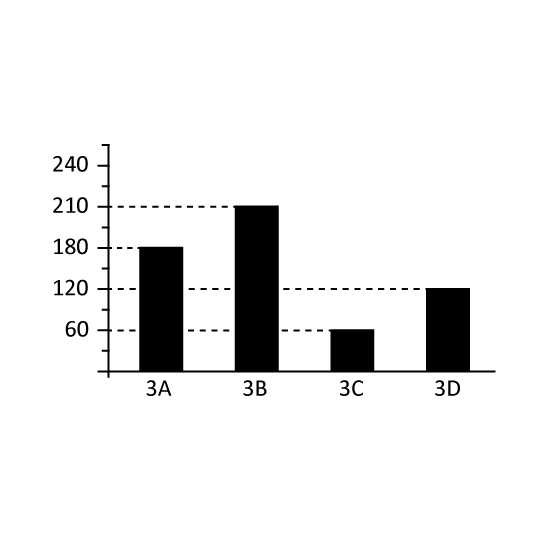
The bar graph shows the number of books Primary 3 students read over a week.
- Class __ and ___ read 240 books in total.
- For every 3 books read by the students, they can exchange for 1 gift. How many more gifts did Class 3B exchange than Class 3C?
Level 2
The bar graph shows the number of books Primary 3 students read over a week.
- Class __ and ___ read 240 books in total.
- For every 3 books read by the students, they can exchange for 1 gift. How many more gifts did Class 3B exchange than Class 3C?
Image in this question is not available.
Level 2
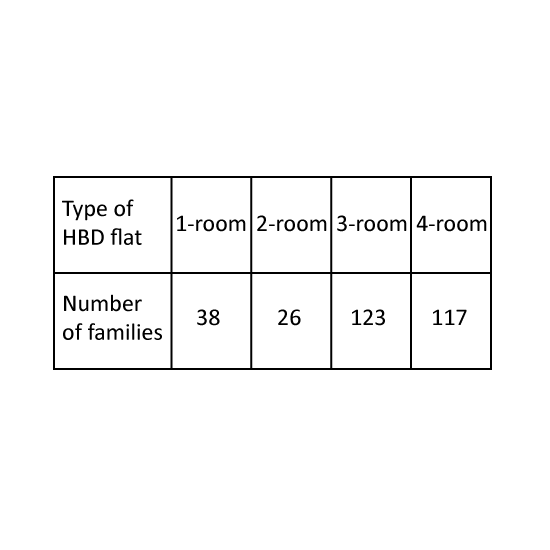
The table shows the number of families living in different types of HDB flats in a new town last year. This year, 12 families from the 1-room flats and 15 families from 2-room flat moved to 4-room flat. At the same time, 11 families from 3-room flat moved to 2-room flat. How many families live in a HDB flat with less than 3 rooms this year?
Level 2
The table shows the number of families living in different types of HDB flats in a new town last year. This year, 12 families from the 1-room flats and 15 families from 2-room flat moved to 4-room flat. At the same time, 11 families from 3-room flat moved to 2-room flat. How many families live in a HDB flat with less than 3 rooms this year?
Image in this question is not available.
Level 2
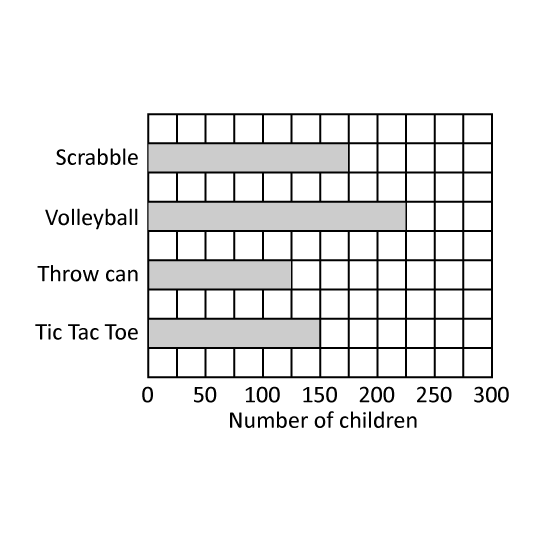
The bar graph shows the number of children who like a game. How many more children like tic tac toe than volleyball?
Level 2
The bar graph shows the number of children who like a game. How many more children like tic tac toe than volleyball?
Image in this question is not available.
Level 1
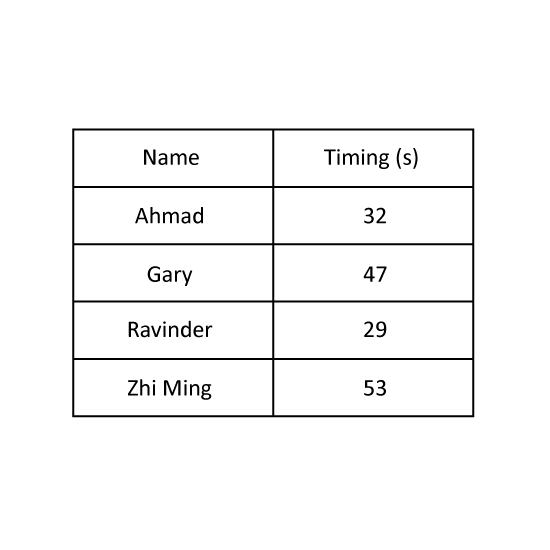
Ahmad, Gary, Ravinder and Zhi Ming had a race and their timings are recorded. Who came in second in the race?
Level 1
Ahmad, Gary, Ravinder and Zhi Ming had a race and their timings are recorded. Who came in second in the race?
Image in this question is not available.
Level 1
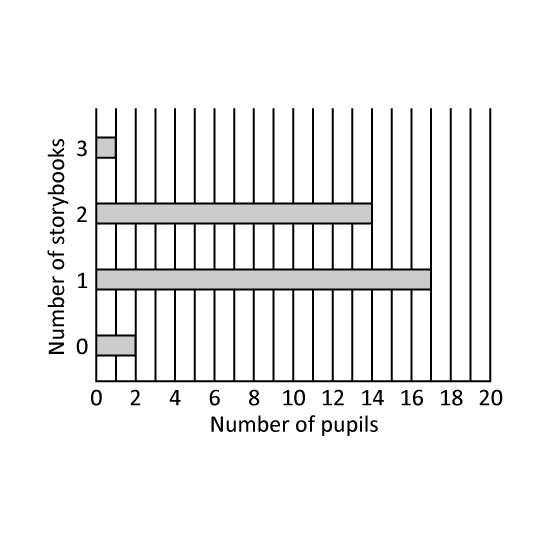
The graph shows the number of books borrowed by 40 pupils in a class.
How many pupils borrowed 4 storybooks?
Level 1
The graph shows the number of books borrowed by 40 pupils in a class.
How many pupils borrowed 4 storybooks?
Image in this question is not available.
Level 2
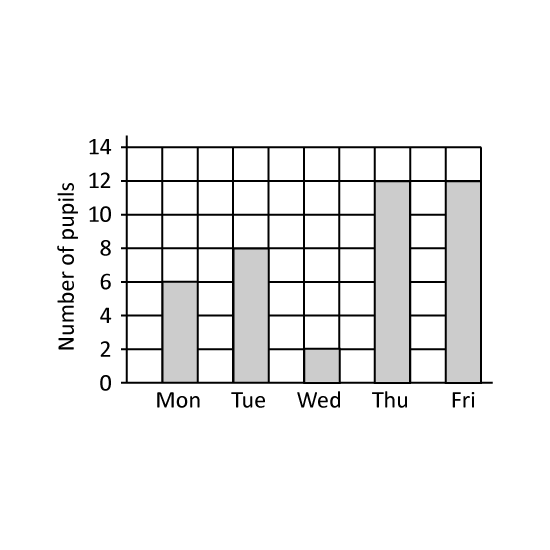
The graph shows the number of students who visited the library. How many more students visited the library on Friday more than on Wednesday?
Level 2
The graph shows the number of students who visited the library. How many more students visited the library on Friday more than on Wednesday?
Image in this question is not available.
Level 1
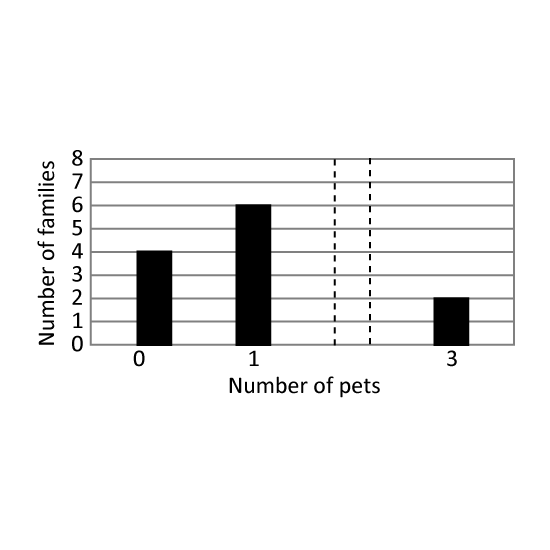
The bar graph shows the number of pets owned by the families living in a block of flats. There are a total of 20 pets in the block. The bar that shows the number of families that has 2 pets is not drawn. How many families have 2 pets?
Level 1
The bar graph shows the number of pets owned by the families living in a block of flats. There are a total of 20 pets in the block. The bar that shows the number of families that has 2 pets is not drawn. How many families have 2 pets?
Image in this question is not available.
Level 1
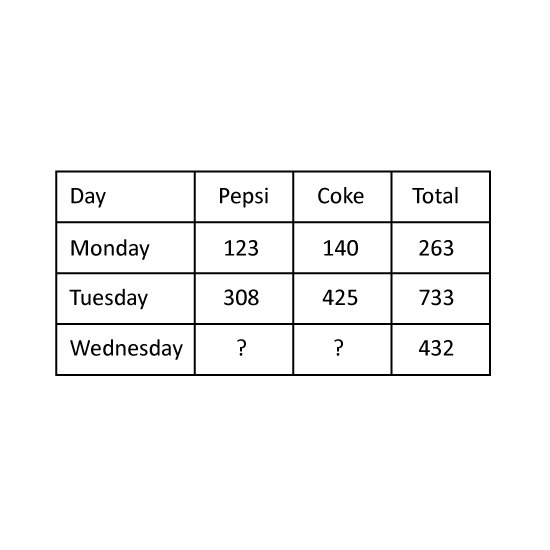
The table shows the number of canned drinks sold during a softball carnival over three days. The number of Coke sold on Wednesday is three times the number of Pepsi, how many cans of Coke were sold on Wednesday?
Level 1
The table shows the number of canned drinks sold during a softball carnival over three days. The number of Coke sold on Wednesday is three times the number of Pepsi, how many cans of Coke were sold on Wednesday?
Image in this question is not available.
Level 2
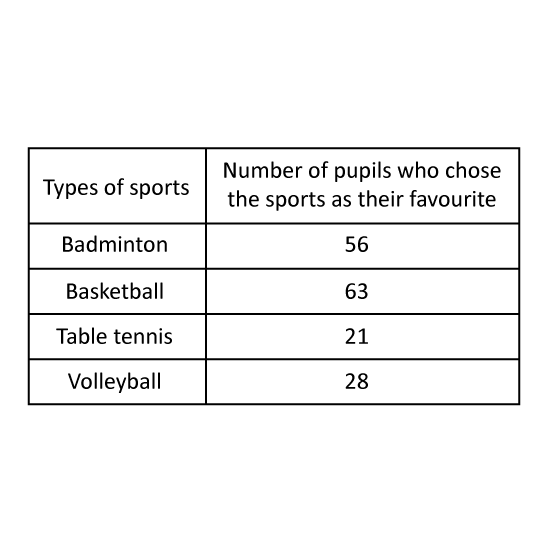
A group of 168 primary four pupils was surveyed to name their favourite sport.
The table shows their choices.
38 of the pupils chose one of the sports as their favourite. Which is the sport? Give your answer in number. (Eg 1)
Level 2
A group of 168 primary four pupils was surveyed to name their favourite sport.
The table shows their choices.
38 of the pupils chose one of the sports as their favourite. Which is the sport? Give your answer in number. (Eg 1)
Image in this question is not available.